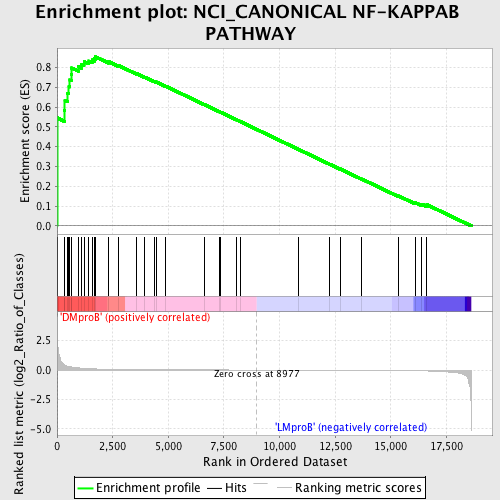
Profile of the Running ES Score & Positions of GeneSet Members on the Rank Ordered List
| Dataset | Set_04_DMproB_versus_LMproB.phenotype_DMproB_versus_LMproB.cls #DMproB_versus_LMproB |
| Phenotype | phenotype_DMproB_versus_LMproB.cls#DMproB_versus_LMproB |
| Upregulated in class | DMproB |
| GeneSet | NCI_CANONICAL NF-KAPPAB PATHWAY |
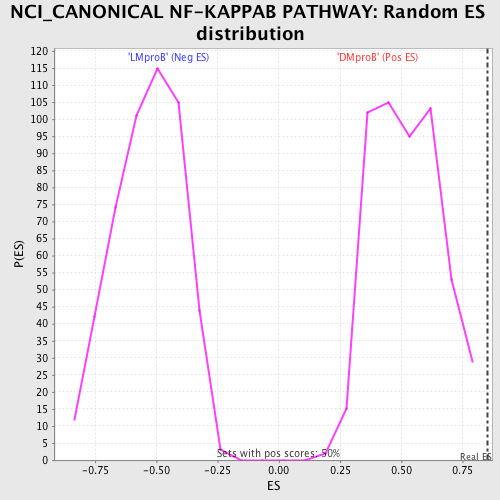
| Enrichment Score (ES) | 0.8533844 |
| Normalized Enrichment Score (NES) | 1.6355759 |
| Nominal p-value | 0.0 |
| FDR q-value | 0.25436938 |
| FWER p-Value | 0.442 |
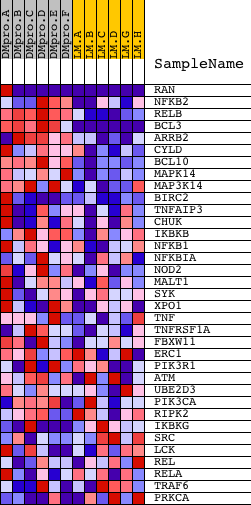
| PROBE | DESCRIPTION (from dataset) | GENE SYMBOL | GENE_TITLE | RANK IN GENE LIST | RANK METRIC SCORE | RUNNING ES | CORE ENRICHMENT | |
|---|---|---|---|---|---|---|---|---|
| 1 | RAN | 5356 9691 | 1 | 4.293 | 0.5457 | Yes | ||
| 2 | NFKB2 | 23810 | 323 | 0.440 | 0.5844 | Yes | ||
| 3 | RELB | 17942 | 353 | 0.406 | 0.6344 | Yes | ||
| 4 | BCL3 | 8654 | 478 | 0.324 | 0.6690 | Yes | ||
| 5 | ARRB2 | 20806 | 533 | 0.295 | 0.7035 | Yes | ||
| 6 | CYLD | 18532 | 576 | 0.278 | 0.7367 | Yes | ||
| 7 | BCL10 | 15397 | 634 | 0.260 | 0.7667 | Yes | ||
| 8 | MAPK14 | 23313 | 659 | 0.251 | 0.7973 | Yes | ||
| 9 | MAP3K14 | 11998 | 953 | 0.183 | 0.8047 | Yes | ||
| 10 | BIRC2 | 4397 4398 | 1107 | 0.157 | 0.8165 | Yes | ||
| 11 | TNFAIP3 | 19810 | 1209 | 0.144 | 0.8294 | Yes | ||
| 12 | CHUK | 23665 | 1431 | 0.118 | 0.8325 | Yes | ||
| 13 | IKBKB | 4907 | 1576 | 0.104 | 0.8379 | Yes | ||
| 14 | NFKB1 | 15160 | 1685 | 0.094 | 0.8440 | Yes | ||
| 15 | NFKBIA | 21065 | 1727 | 0.091 | 0.8534 | Yes | ||
| 16 | NOD2 | 6384 | 2311 | 0.055 | 0.8290 | No | ||
| 17 | MALT1 | 6274 | 2762 | 0.038 | 0.8096 | No | ||
| 18 | SYK | 21636 | 3583 | 0.021 | 0.7681 | No | ||
| 19 | XPO1 | 4172 | 3943 | 0.017 | 0.7509 | No | ||
| 20 | TNF | 23004 | 4358 | 0.013 | 0.7303 | No | ||
| 21 | TNFRSF1A | 1181 10206 | 4458 | 0.013 | 0.7266 | No | ||
| 22 | FBXW11 | 20926 | 4875 | 0.010 | 0.7056 | No | ||
| 23 | ERC1 | 1013 17021 995 1136 | 6638 | 0.004 | 0.6113 | No | ||
| 24 | PIK3R1 | 3170 | 7286 | 0.003 | 0.5769 | No | ||
| 25 | ATM | 2976 19115 | 7358 | 0.003 | 0.5734 | No | ||
| 26 | UBE2D3 | 7253 | 8043 | 0.002 | 0.5368 | No | ||
| 27 | PIK3CA | 9562 | 8243 | 0.001 | 0.5263 | No | ||
| 28 | RIPK2 | 2528 15935 | 10827 | -0.003 | 0.3877 | No | ||
| 29 | IKBKG | 2570 2562 4908 | 12258 | -0.006 | 0.3115 | No | ||
| 30 | SRC | 5507 | 12717 | -0.008 | 0.2879 | No | ||
| 31 | LCK | 15746 | 13697 | -0.012 | 0.2367 | No | ||
| 32 | REL | 9716 | 15347 | -0.029 | 0.1515 | No | ||
| 33 | RELA | 23783 | 16089 | -0.050 | 0.1180 | No | ||
| 34 | TRAF6 | 5797 14940 | 16377 | -0.064 | 0.1107 | No | ||
| 35 | PRKCA | 20174 | 16623 | -0.077 | 0.1073 | No |